GridInspector: A Global Diagnostic of Open Power Grid Data
January 5, 2026 by Marina Petkova
Power grid data quality is a global blind spot
OpenStreetMap (OSM) is today the only globally unified, openly accessible, harmonized database describing power grid infrastructure. It is increasingly used in research, planning, development projects, and exploratory energy analysis.
Yet, one fundamental issue remains largely unaddressed: data quality is uneven, difficult to assess, and rarely comparable across countries.
Visual completeness can be misleading, and the apparent presence of infrastructure does not necessarily imply that the data is structurally correct, sufficiently attributed, or usable for analysis.
So when data quality is assumed rather than measured, this uncertainty can lead to fragile analyses, incorrect conclusions, and limited trust from institutional or technical stakeholders. This situation raises a recurring and practical question.
A recurring question we could not answer reliably
Can OpenStreetMap power grid data be used with confidence, and under which conditions?
Despite the growing use of OpenStreetMap, answering this question at scale has proven difficult. Existing quality assurance tools focus on local or object level issues, while academic studies are often one off, country specific, and not easily reproducible. Practitioners, contributors, and institutions lack a shared, accessible framework to assess data quality consistently across territories.
And it was this gap between usage and confidence that was the starting point for GridInspector.
Introducing GridInspector: a shared lens on data quality
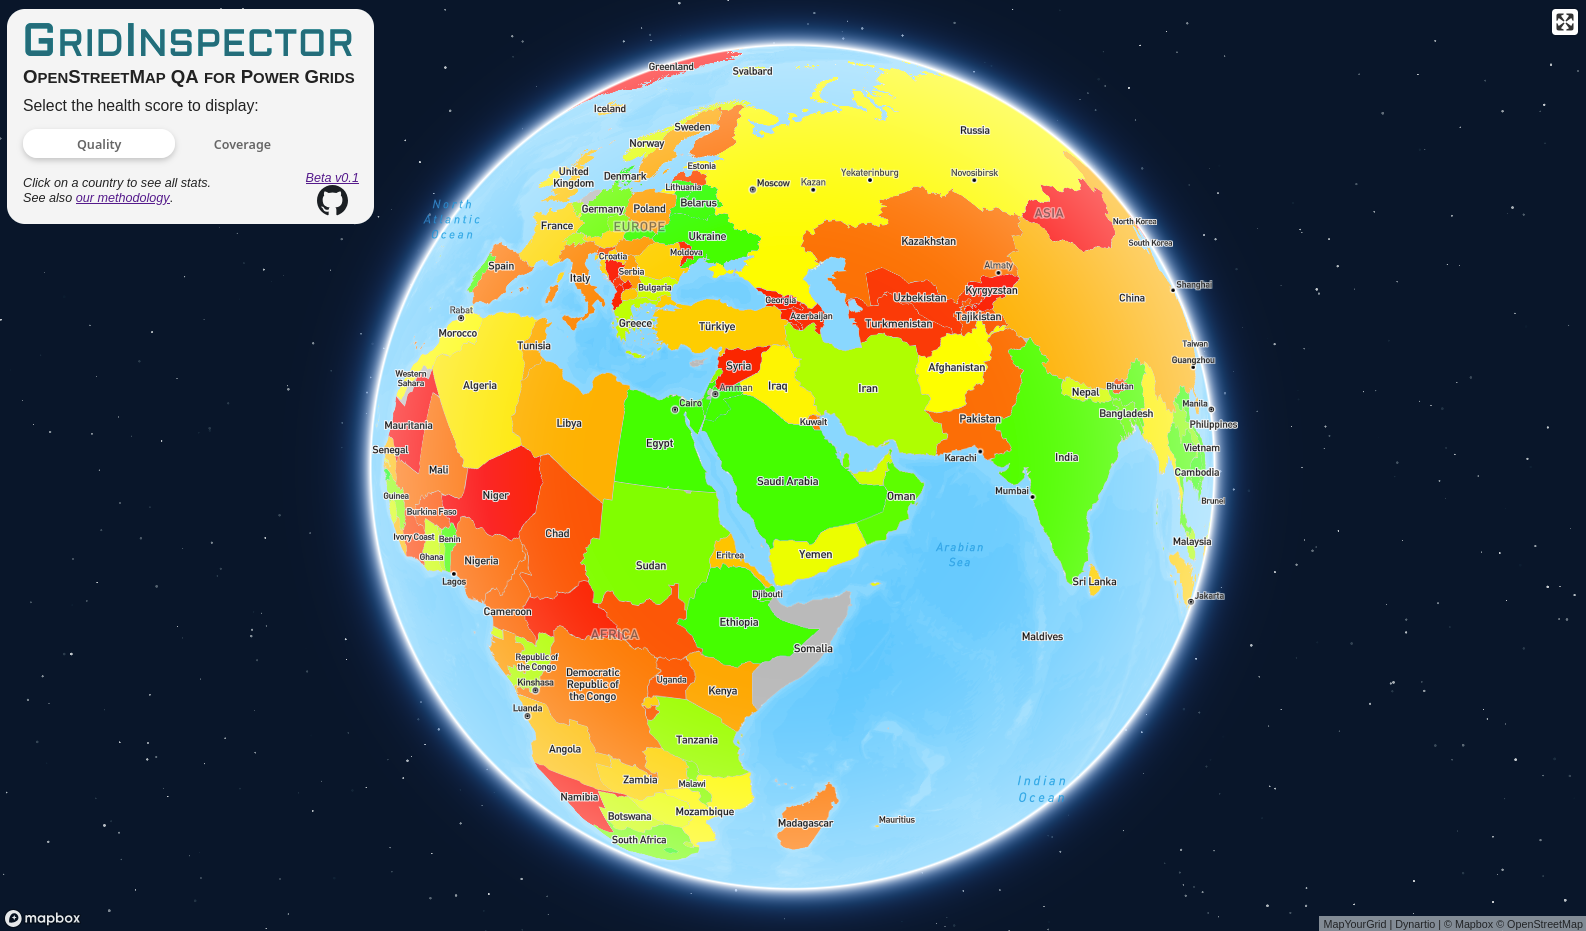

GridInspector is an experimental, open platform designed to assess the quality of OpenStreetMap power grid data at a global scale.
To our knowledge, it is the only initiative offering a systematic, consistent, and cross country comparable assessment of OpenStreetMap power grid data quality.
GridInspector is a rule-based quality assessment tool. It does not aim to replace existing OSM data quality tools. Instead, it provides a complementary perspective: a high level diagnostic that makes data quality visible, comparable, and discussable across countries.
From the outset, it was designed as a shared lens rather than an expert only instrument.
Clarity over complexity
Our objective was not to build a complex technical audit or a black box scoring system, but rather to provide a clear, visual, and synthetic overview of data quality and coverage at a glance.
This choice was intentional. Data quality indicators only become useful when they are understandable, reproducible, and actionable by a broad range of actors. By prioritizing clarity over complexity, GridInspector aims to support coordination, prioritization, and collective decision making.
The underlying methodology is generic by design and can be adapted to other infrastructure domains such as water, transport, or telecommunications.
Who GridInspector is built for?
GridInspector was built with a diverse audience in mind, because data quality is a shared concern:
- Researchers and practitioners working on energy systems, networks, or geospatial data;
- Transmission System Operators (TSOs) seeking to consolidate or benchmark their internal datasets;
- Governments and public institutions supporting energy planning and territorial diagnostics;
- Engineering and installation companies in early stage studies or market exploration;
- NGOs and international development actors identifying priority areas for intervention;
- OpenStreetMap contributors, to understand where their efforts will have the greatest impact.
Designing for this diversity strongly influenced the choice of indicators and the way results are presented.
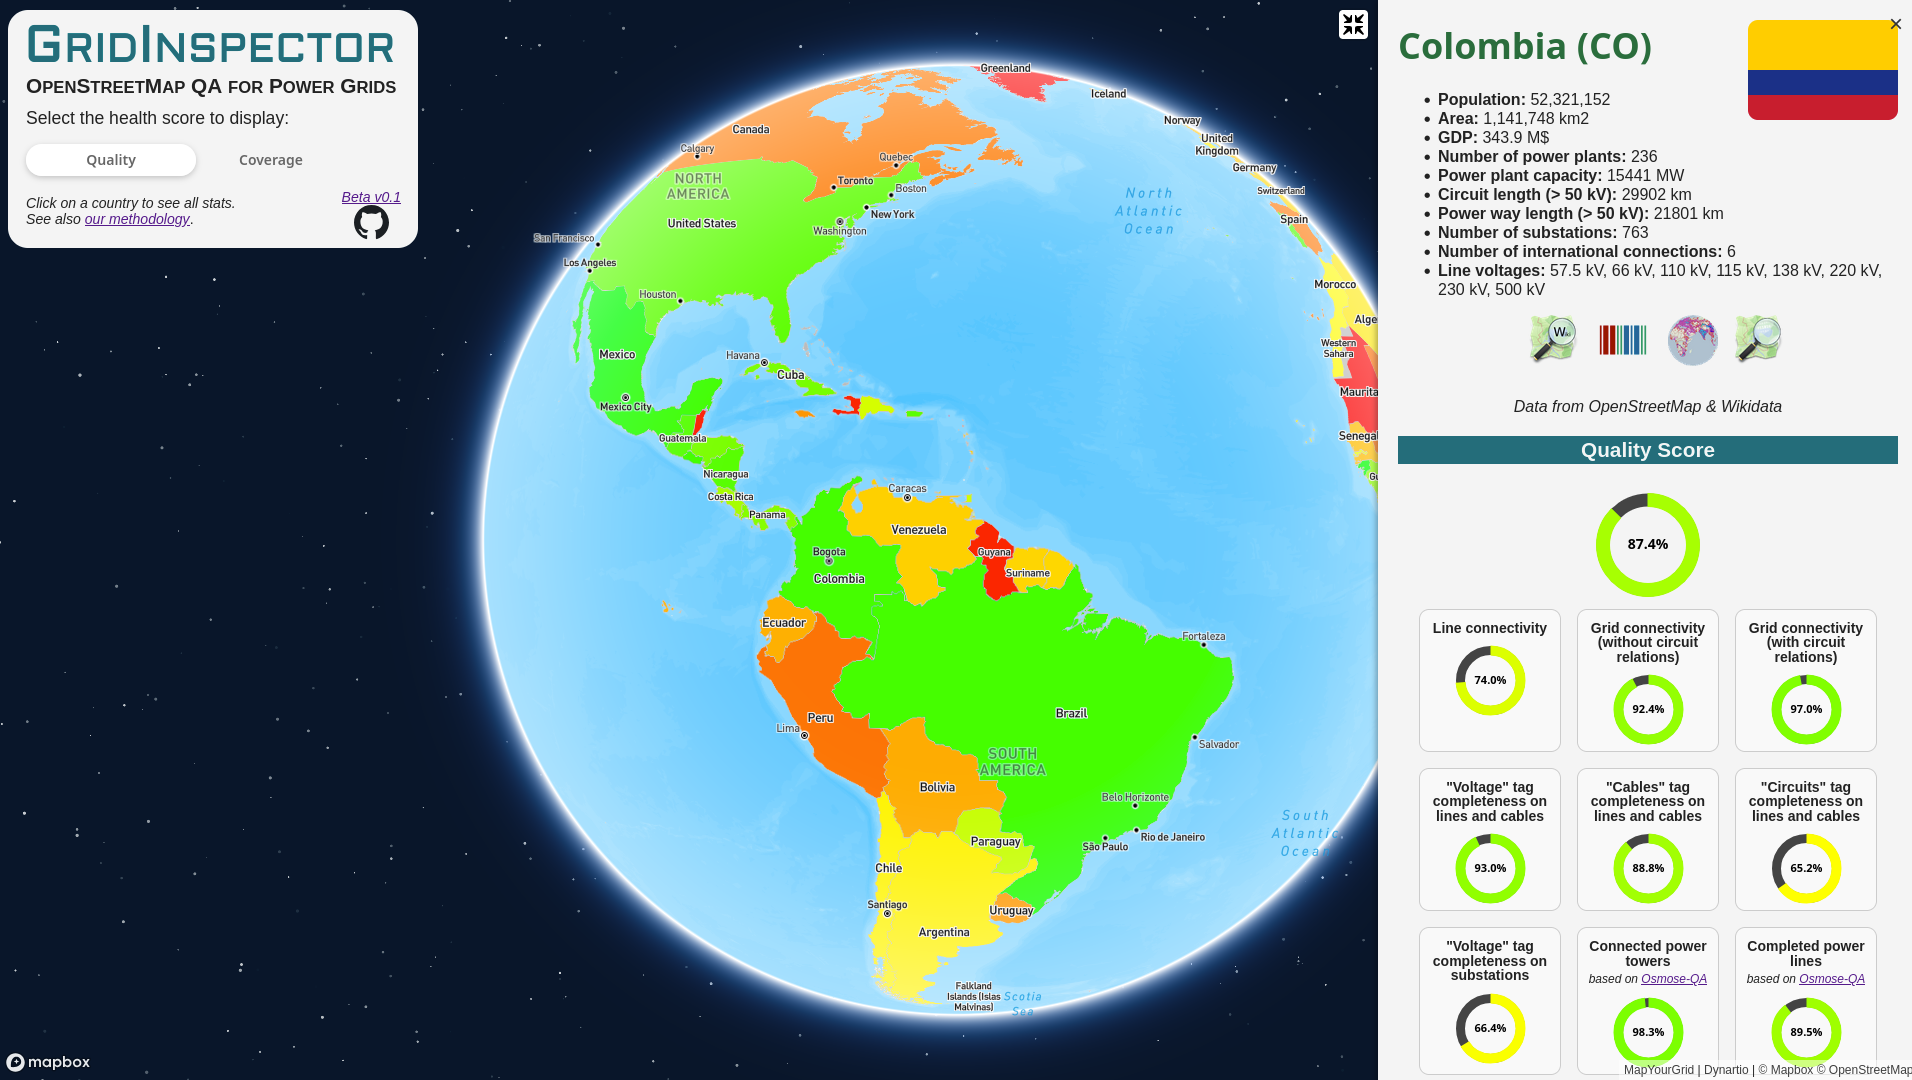
What GridInspector measures?
GridInspector goes beyond counting line kilometers. It aggregates eleven indicators, grouped into two complementary categories. The first focuses on internal consistency. These indicators assess whether power grids are logically and structurally sound, including connectivity between lines and substations, the presence of key attributes such as voltage, number of cables and circuits, the use of circuit relations, and the continuity of the electrical graph.
The second focuses on completeness against reference data. When official datasets are available, GridInspector compares OpenStreetMap with these sources and highlights gaps between declared and mapped line lengths by voltage level. All reference datasets used are documented transparently, in our Global Grid Data list, as well as in the Global Transmission Length Index.
Some indicators are derived from Osmose, the native OpenStreetMap quality assurance tool, while others were developed specifically for this project.
The rules underlying GridInspector were defined and stabilized progressively over several months, through iteration and confrontation with real world use cases. All of them are documented on this Wiki Page. Some indicators evolved as we tested them across diverse national contexts, adjusted thresholds, and aligned them with established practices within the OpenStreetMap community. This iterative process was essential to ensure that indicators remained meaningful, comparable, and robust.
What GridInspector changed for MapYourGrid?
For us, GridInspector is a decision making instrument, rather than a simple analysis tool. It enabled us to prioritize countries and regions where mapping efforts would deliver the most value, track the effectiveness of contributions over time, objectively measure progress, and structure related projects such as Podoma.
Concrete results illustrate this impact. Coverage increased from 69.4 percent to 98.3 percent in Bulgaria, and from 66.5 percent to 82.8 percent in Colombia. Overall data quality improved by 10 to 20 points in these countries. Many other territories show significant progress, documented on our Progress page.
These outcomes confirm that focused contributions guided by clear indicators are far more effective than unguided mapping efforts.
What do the results teach us?
One of the most counterintuitive findings is that the quality of OpenStreetMap data is not always correlated with the level of power grid development, but depends on the strength of the OpenStreetMap community in a given country. While well-structured datasets exist in Mexico, Brazil, Thailand, Egypt, countries such as Canada, Spain, and Italy still show substantial room for improvement.
Globally, the main weakness is the lack of information regarding line voltage, the number of cables and the number of circuits across many parts of the network. It is challenging to derive these attributes from aerial imagery alone, and they require either local knowledge or an advanced understanding of power grid mapping. Most general OpenStreetMap contributors are not necessarily familiar with how to reliably derive and tag them.
In terms of completeness, several Sub Saharan African countries now reach very good coverage levels, including Tanzania, Zambia, the Democratic Republic of Congo, Kenya, Namibia, Mozambique, and Ethiopia.
By contrast, China represents the largest blind spot in global coverage. A significant share of its transmission network is missing from OpenStreetMap. Given the scale of the Chinese grid, this strongly affects global figures. Overall OpenStreetMap power grid completeness is currently around 76 %, and would be at around 85 % if we exclude China from the equation.
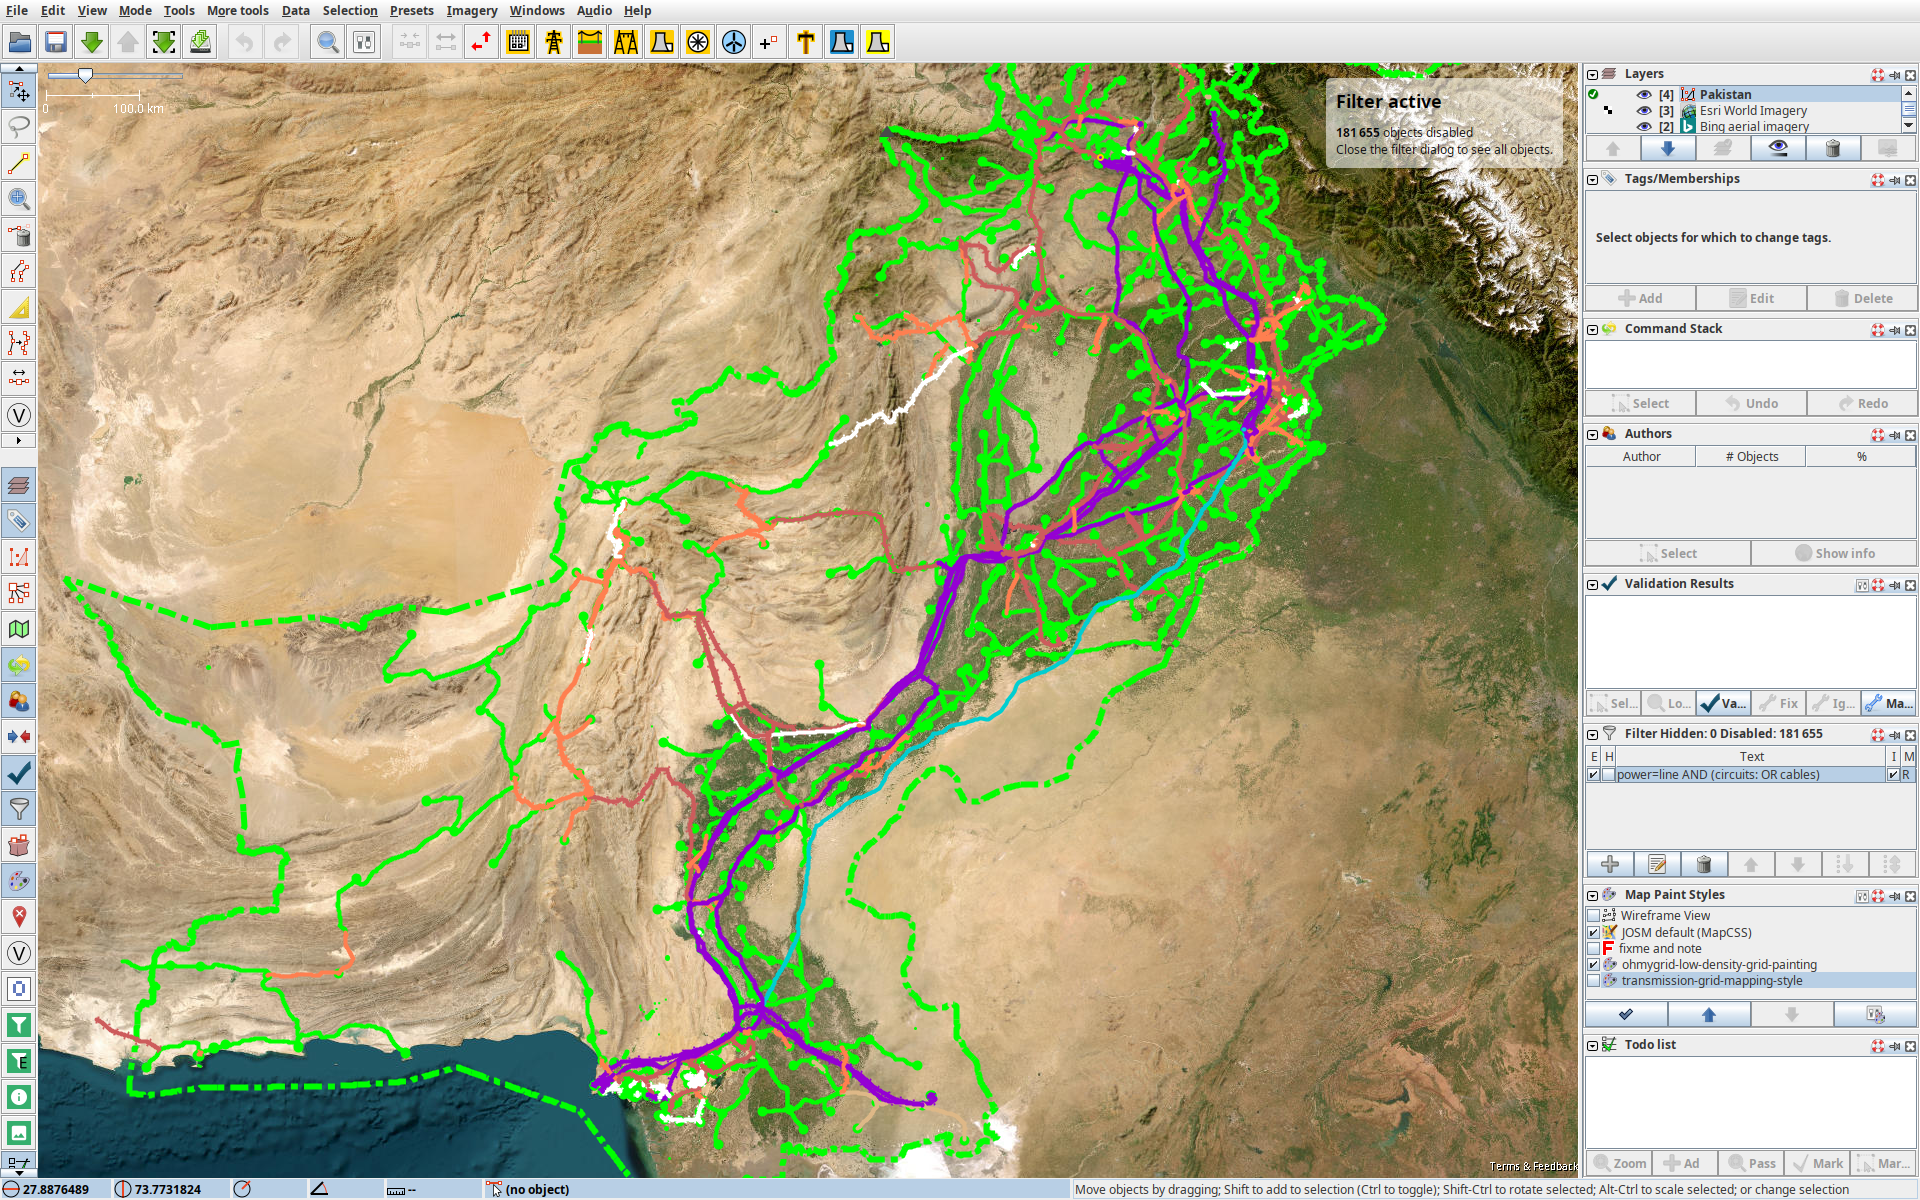
How we made this possible?
These insights are the result of several months of technical work. Building GridInspector required collecting and harmonizing heterogeneous data sources, constructing country level connectivity graphs, automating indicator computation through Python scripts, and publishing results via an interactive Mapbox map.
The platform also orchestrates interactions with other tools such as Osmose, Overpass, Podoma, WikiData and OpenInfraMap. This work involved multiple iterations and technical trade offs to ensure reproducibility and scalability. All indicators were compared qualitatively and quantitatively with the mapping experience in different countries.
All processing code is open source and publicly available on GitHub
What comes next and why further funding matters now ?
While the core components of GridInspector are now in place, many extensions are possible. Further developments include:
- Adding new indicators derived from additional power grid validation rules;
- Analyzing substation completeness including names, identifiers, operator and Wikidata IDs;
- Analyzing the recent active power mapping community and the number of mappers compared to the size of the national grid;
- Integrating and assessing power generation facilities issues from osmose and issues created by OSM Power Plants;
- Producing regional level analyses at state or provincial scale;
- Improving UX and UI, as well as developing a mobile version;
- Exploring image processing to detect substations and lines, and estimate the accuracy of geographic mapping;
- Using the voltage for dynamic threshold and dynamic health score weighting;
- Integrating and cross-validating completeness values from ohsome.
But, sustaining and expanding GridInspector requires resources. Maintaining data pipelines, refining indicators, improving usability, and validating the tool through real world applications are ongoing efforts.
At this stage, external use cases, institutional partnerships, and dedicated funding would allow GridInspector to move from a promising prototype to a widely adopted reference tool for open power grid data. Like everything we do, GridInspector is intended as a shared resource, shaped collectively by those who rely on open energy data. We are now actively looking for users, researchers, institutions, and partners interested in testing GridInspector, providing feedback, contributing ideas, or co developing new use cases.
In a nutshell
GridInspector offers a structured, comparative, and actionable way to assess OpenStreetMap power grid data quality. It helps identify where data is robust enough to be used directly, and where mapping efforts should be focused to improve it. It is a tool designed for the community, researchers, grid operators, and anyone aiming to build solid energy analyses on top of open data.
More broadly, it demonstrates how open data quality can be assessed transparently and collaboratively. The foundation is in place. The next step is to prove its value at scale, together.