OpenStreetMap grid data, the hidden superhero of the US’ national security?
September 18, 2025 by Andreas Hernandez Denyer
California wildfires, the Colonial Pipeline cyberattack, hurricane and flooding responses such as Hurricane Maria, all have something in common: EAGLE-I. EAGLE-I (Environment for Analysis of Geo-Located Energy Information), developed by the US Department of Energy, is an emergency and strategic planning system used to monitor energy infrastructure, coordinate emergency responses, and restore critical energy systems. What these tools also incorporate is data. A lot of data.
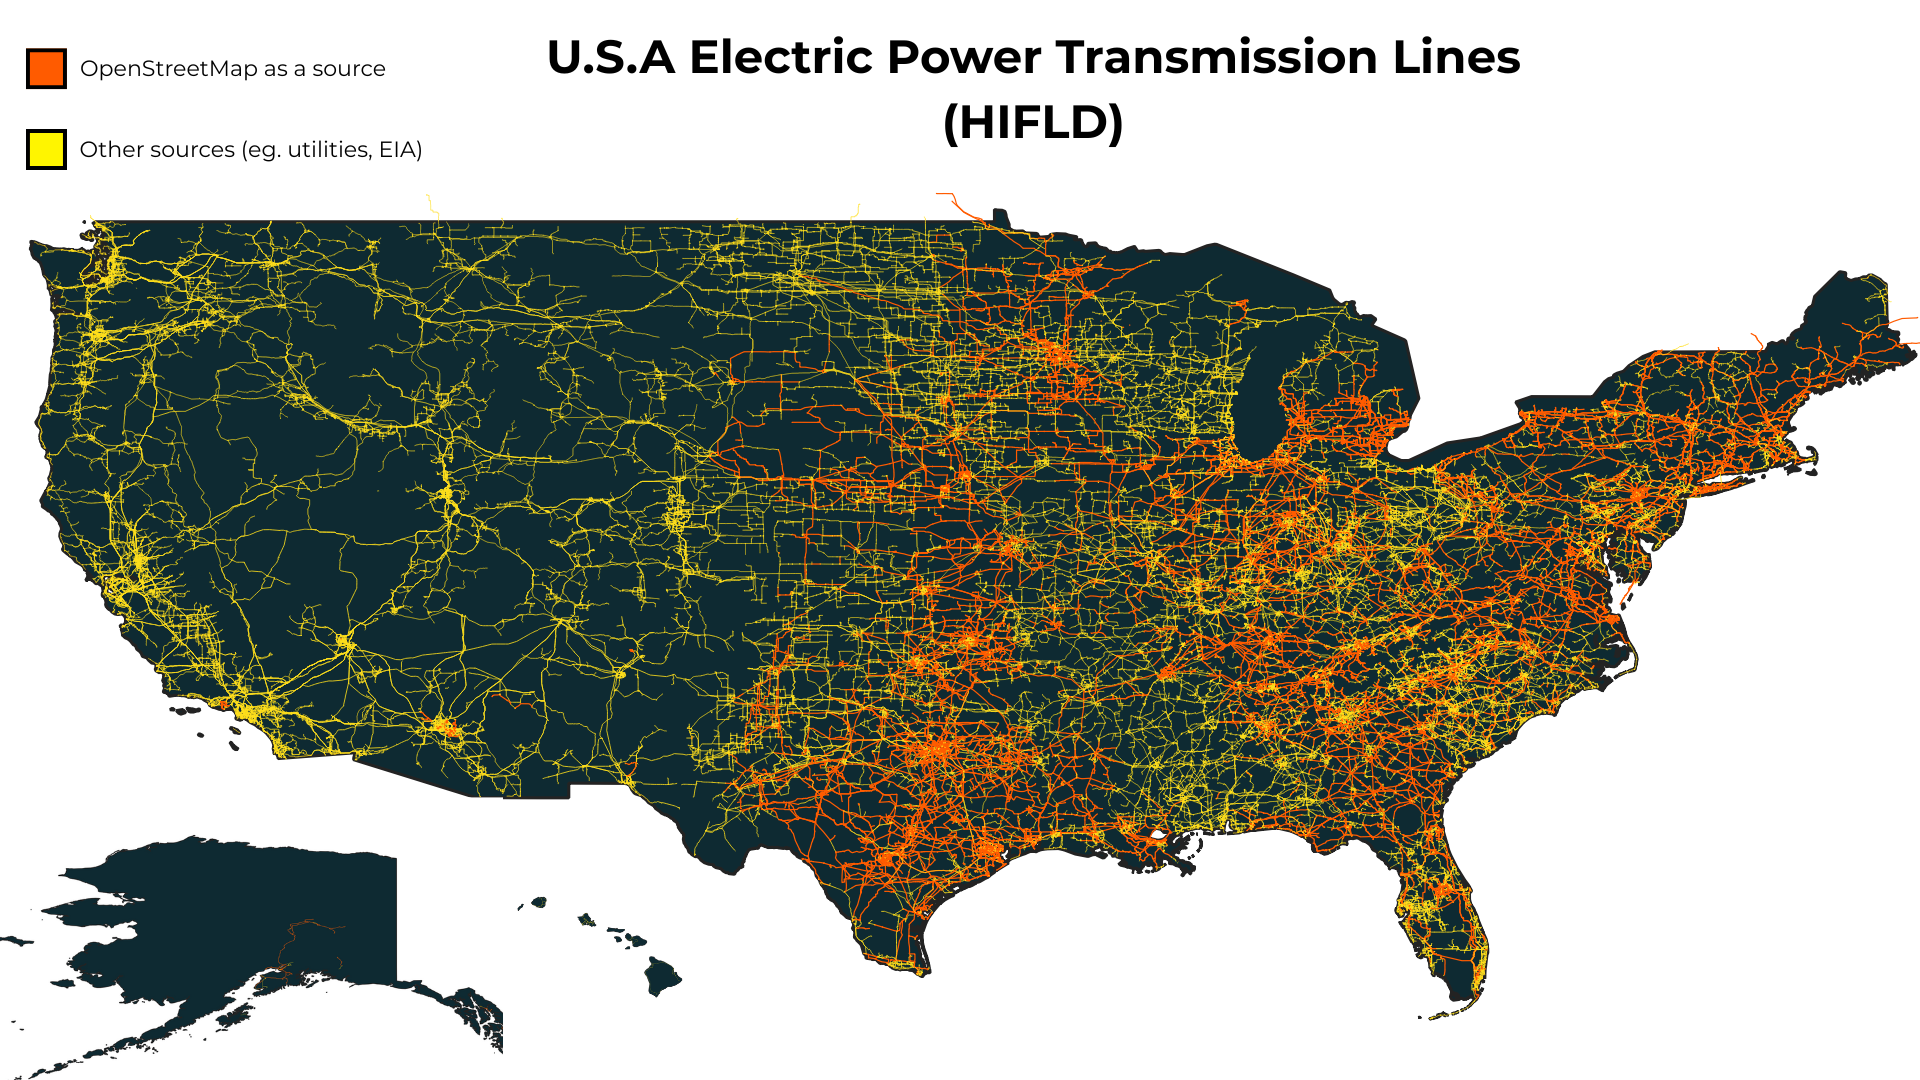
One of the fundamental layers of data used by these tools comes from the Homeland Infrastructure Foundation Level Data (HIFLD), which contains electric power transmission lines for all of the US. What many don’t know is that a relatively large portion of this grid data has OpenStreetMap as one of the sources, and in some cases OpenStreetMap is the only source. Indeed, around 25% of features in the data layer have OpenStreetMap as a source, which is roughly 301,600km out of the 950,500km of electric power lines (32%) of the US. You sometimes hear people doubt the usefulness and quality of OpenStreetMap data since it’s community-driven. However, it’s clear that the US HIFLD deems it to be reliable to be incorporated into its datasets, and thus the tooling that relies on this data, which in turn are used for large-scale decision-making.
For example, the URBAN-NET tool incorporated in EAGLE-I, developed by ONRL, is used by: the Office of Cybersecurity, Energy Security, and Emergency Response (CESER), FEMA, and other state, federal, and local agencies. It was used for example in the case of a cyberattack on the Colonial Pipeline in 2021, to understand how the gas pipeline shutdown affected crude flows and refinery operations. However, gas is intertwined with power grids, so having a tool like URBAN-NET that can represent the dependencies between different energy resources is key in making reliable assessments. However, what is needed for these assessments to be accurate? Data.
Some have security worries with grid infrastructure location data being open, however many studies and practices show that this data being open does not elevate threat levels. Furthermore, critical infrastructure such as substations can be easily seen and located in Earth observation and satellite imagery data such as Google Maps, which sophisticated actors would already be aware of. Locations and images of substations can be found online, with for example Google Maps listing most of the larger substations' location, including on sight images, all around the world since 20 years. So, if anything, the usage of OpenStreetMap data in HIFLD datasets, shows how national security can be increased due to better data, and thus better planning and modelling.
So, OpenStreetMap grid data is therefore an important source as it has, and can be used to validate existing sources, and can also be the only source of grid data there is. Furthermore, since the future of this data is unclear due to the decision of removing HIFLD Open Data which you can read about here, OpenStreetMap could play an ever increasing role as the foundation for open power grid data. With the MapYourGrid initiative, this is what we are trying to achieve globally.
More sources and usage of EAGLE-I and potentially HIFLD grid data
1) Creating Foundation Electric Energy Infrastructure Data from Open-Sources
2) Component Assessment of the Electric Transmission Grid to Hurricanes
3) US Department of Energy: Grid-Enhancing Technologies:A Case Study on Ratepayer Impact
4) US Department of Energy: National Transmission Needs Study:Supplemental Material
5) Wildfire webinar mentioning how the "power infrastructure layer" is useful
MapYourGrid is a free, open-source initiative supported by Open Energy Transition, Datactivist, Dynartio, Jungle Bus, Infrageomatics.