Behind The Scenes of MapYourGrid
September 8, 2025 by Marina Petkova
In August 2025, we made MapYourGrid publicly available. For seven months before that, our team of developers, data scientists, energy experts worked side by side, testing tools and mapping grids ourselves. The purpose of this internal phase was to set the ambition, adjust our workflows, identify weaknesses in the tools, and understand the mapping challenges ourselves before inviting wider participation.
The public release marked the start of a different stage: building the map with contributions from local mapping communities and individuals with the skills or knowledge to improve grid data. This post documents the context, methods, and early outcomes of that process.
Why we started MapYourGrid?
Mapping the world’s electrical transmission networks is the foundation for tomorrow’s energy systems.
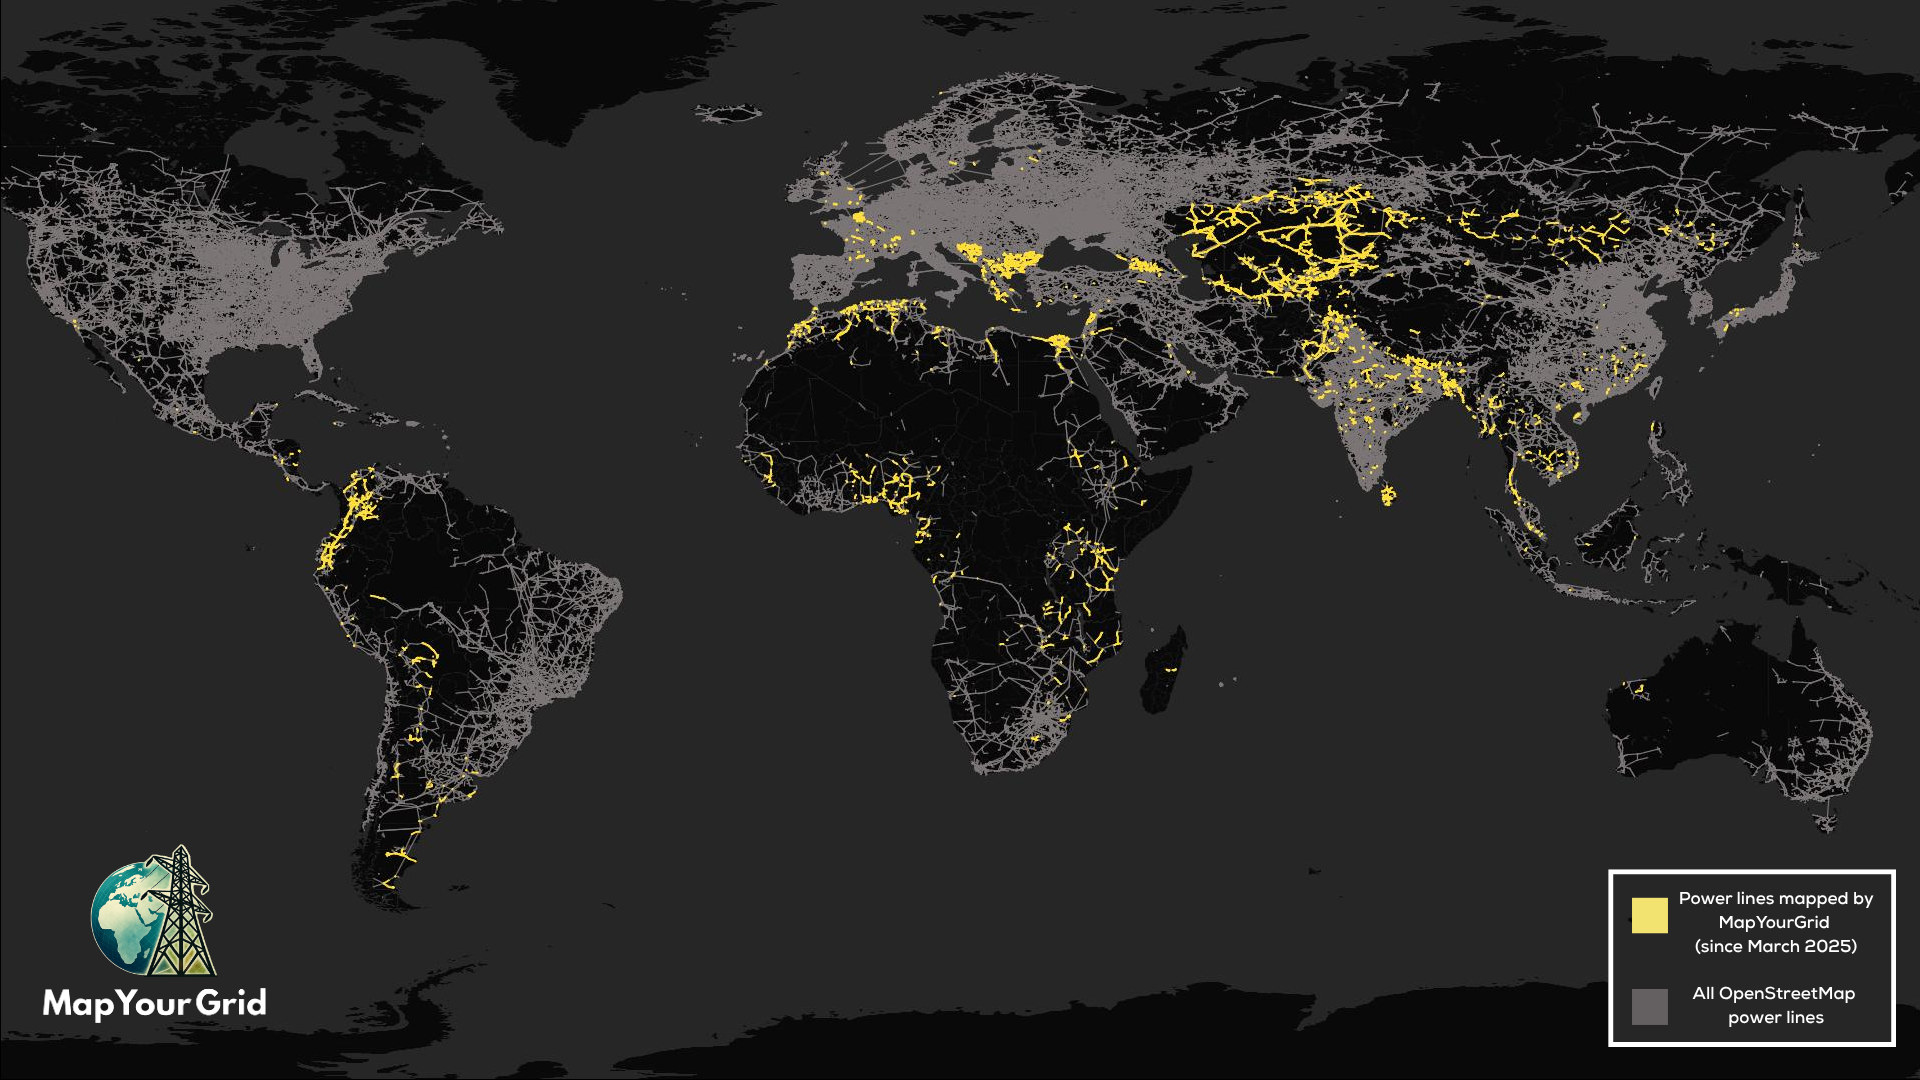
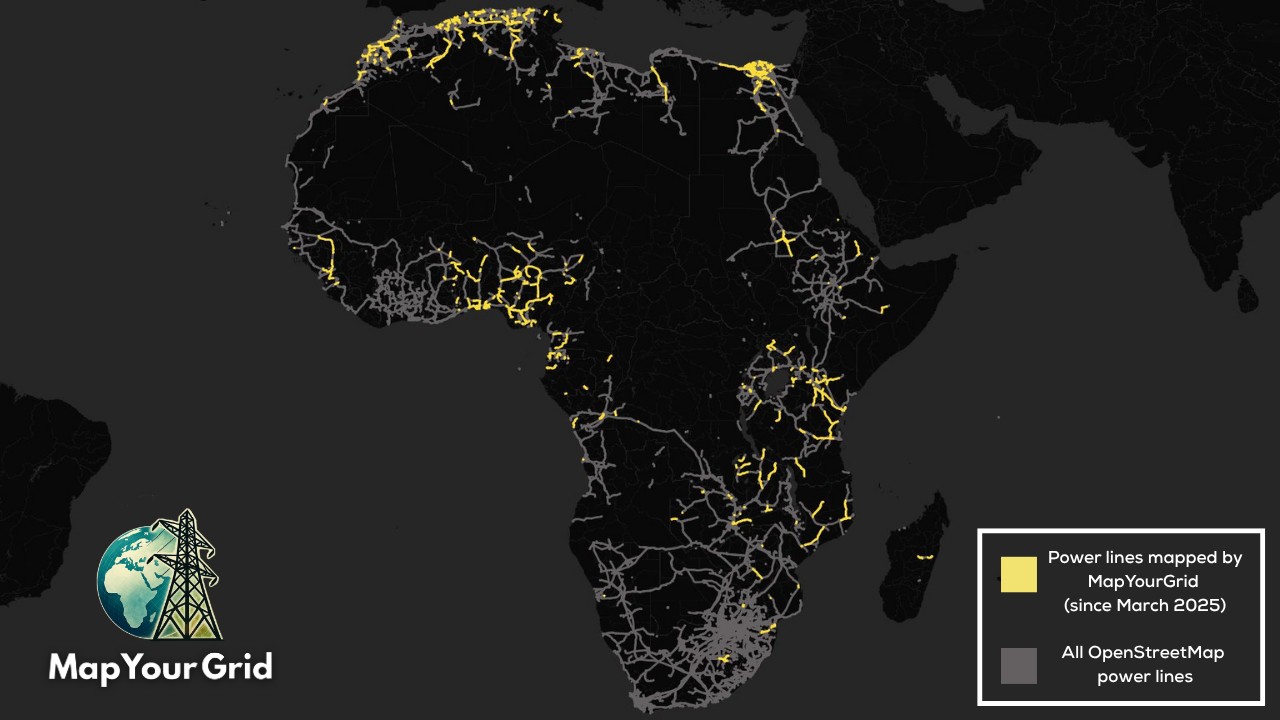
While OpenStreetMap (OSM) has become a go-to reference for governments, academia, and industry, coverage is far from complete. In much of the Global South, reliable electricity grid maps are patchy at best and prohibitively expensive at worst. In some regions, the only datasets available are locked behind costly proprietary licenses, out of reach to those who need them most.
Without accurate, open data on where transmission lines, towers, substations, and plants are located, energy planners are working blind. Renewable projects stall, cross-border integration slows, and in fast-growing emerging markets, the lack of visibility blocks economic growth, electrification, and climate resilience.
We created MapYourGrid to close that gap and push global transmission grid coverage in OpenStreetMap from roughly 70% to 98% by 2028. We knew this couldn’t be done by a single organization. It would take local mapping communities tracing lines from satellite imagery or on-site surveys, energy specialists validating data, open-source developers building better tools, and NGOs mobilizing people on the ground.
The beginning of MapYourGrid
The idea for MapYourGrid started within Open Energy Transition. We had an amazing opportunity to secure support through a Breakthrough Energy grant that allowed to bring in partners, start mapping and build more appropriate tooling.
Early in the project, we brought together four partner organisations from France and the UK with expertise in open data, cartography, and power infrastructure mapping. Their role was to anchor the initiative with deep OpenStreetMap experience. This included understanding OSM tools and how to use them for grid connectivity analysis. And also thinking about how to inform, equip, and invite OSM contributors to participate, as well as how to train and encourage energy-sector practitioners and researchers to contribute their knowledge directly to OSM.
The initial scope was to work on at least one country per continent, focusing in particular on +60 kV transmission networks. Selecting countries also meant casting a wide net. We had to look at many possibilities, testing both the feasibility of mapping and the availability of official information on the state of their transmission networks. This process of exploration and verification led to the creation of our list of publicly available grid maps, a running record of the countries we examined and the sources we checked.
Initially, the idea was to use existing open datasets on transmission grids as a starting point, evaluating their maturity, determining whether they could be relied on, and, where possible, using them to support mapping in the selected countries. In practice, many of the datasets we found and analysed reviewed to be incomplete, outdated, or not sufficiently verifiable for our purposes. This made clear that we could not rely only on external datasets for our work. Instead, we turned to mapping strategies : structured workflows using satellite imagery, ground surveys where possible, and contributor validation. This means that we were able to map a lot of the transmission lines ourselves and thus create new, verifiable data in OpenStreetMap, that can be used and maintained by the community.
Another one of the early needs identified during our discussions was to clarify the set of editing and quality-control tools we would use. In particular, we needed to clarify the role of Osmose. Osmose is a quality-assurance tool widely used in the OSM ecosystem. It scans the map data, detects potential issues or inconsistencies, and suggests corrections to contributors. For us, Osmose provides a systematic way to check whether power lines, substations, and other infrastructure are mapped correctly and consistently across regions. It also complements other tools by Open Energy Transition, such as PyPSA-Earth, by ensuring that the raw OSM data is reliable before being used in connectivity analyses.
So in March 2025, the core team was formally established, bringing together Open Energy Transition, Datactivist, Dynartio, Jungle Bus and Infrageomatics. With the partnership in place and the first strands of work underway, it became clear that the project’s impact would depend as much on the people contributing as on the tools and methods themselves.
The people that power MapYourGrid
Our Core Team
We are developers, data scientists, power grid experts, cartographers, and OpenStreetMap contributors. Each member of our team plays a distinct role: writing tools, publishing documentation, designing training resources, refining mapping workflows. And most importantly, we’re all active mappers, which means that we test our own tools and learn from the same challenges contributors face. But our core team is just the starting point. The real potential lies in the community we’re building around it.
The Communities and Contributors
MapYourGrid’s long-term success depends on a collaborative effort across disciplines that brings together different skills, perspectives, and resources.
Right now, most of our contributors are OpenStreetMap mappers. They trace transmission lines from satellite imagery and fill in the gaps where official data is missing. The OpenStreetMap community is one of the largest, most active, and most resilient open-data networks in the world. It knows how to run mapping events, train new contributors, and collaborate across borders. What we add are the specialized tools, datasets, and guidance that make grid mapping as straightforward in OSM as mapping roads or buildings.
And while mappers are at the heart of this work, we need more people to support the initiative : Open Source developers, energy specialists, people who can mobilise contributors and run workshops.
No single skill is enough. Every person adds something different, and that’s exactly what the project needs to grow. At at its core, the initiative is built on shared values:
Openness : the data we create is freely available and verifiable. We share our methods so others can build on them.
Quality : grid data only matters if it’s accurate enough to be used in real projects.
Collaboration : we work across sectors, disciplines, and borders with everyone who shares our goals.
Purpose : keeping electrification, equity, and climate resilience are at the heart of every strategic decision we make.
Launch day and early reactions
We officially launched MapYourGrid in early August 2025, a day we’d been working toward for quite some time now. In the past five months, we kept things quiet on purpose. We wanted to stress-test our tools, work out the kinks, and do the mapping ourselves before inviting the world in.
For the launch, we reached out on LinkedIn, Reddit, and WeeklyOSM in particular, hoping to connect with as many curious people as possible. We’re now working on sharing the project’s story on more platforms and aiming to speak with sector influencers to help spread the word further.
The launch brought an immediate response from open-source contributors, energy planners, and sector influencers reached out with words of encouragement and offers to collaborate. Some are already lined up for interviews, podcasts, and blog posts we’ll be sharing soon.
Within days, new people joined our Discord and the first feedback from the community came in. That feedback has been valuable, because it gives us a fresh look at how people actually use the tools and points out where we should focus our efforts. Hearing different perspectives helps us make immediate improvements, instead of waiting for problems to pile up. In a collaborative project like this, the feedback loop is important. It means that the community shapes the project just as much as the project supports the community.
In the week after the launch, we noticed more contributors tagging their OpenStreetMap changesets with the project’s hashtag #mapyourgrid. In that time, about 12,000 power towers were mapped by people outside our team. The total of contributors using our hashtag went up from 14 to 29, a clear sign that news of the project was getting around and that others were willing to invest time in mapping.
The launch confirmed that there was interest and capacity in the wider community. The next step was to focus that momentum on a clear set of priorities.
What comes next for MapYourGrid
What you see today is just a start. Over the next six months, our work will concentrate on three priorities: One is the production of a complete and consistent map of all power interconnectors worldwide, using OpenStreetMap as the base dataset. This involves systematically checking whether every known interconnector is present and correctly mapped in OSM, and adding or correcting data where it is missing or inaccurate. The goal is to have a dataset that can be trusted for both technical studies and planning purposes.
Another focus is contributor training. We are working on text and video tutorials, as well as live mapping workshops, so contributors can map their national transmission grids with confidence. As of writing this article, we are in discussion with mappers from Myanmar, Pakistan, Canada, Nigeria and the Democratic Republic of the Congo. These conversations are also shaping the training approach to suit different contexts. Our aim is not only to show communities how to map their grids in detail, but also to create the conditions for peer-to-peer learning. This means contributors exchanging techniques, tools, and validation methods directly with one another, without having to rely solely on the core project team. Hopefully, this will allow knowledge to circulate more widely and make contributors work with more ease.
We are also mapping two specific countries in detail: Zambia and Colombia that we will use as case studies. We chose them because they have enough open and partial grid data to map confidently, and yet both still have significant mapping gaps and the context to fill them. Zambia, with its growing solar development and its heavy hydropower reliance, presents an opportunity to test how our tools handle a grid in transition. Colombia, meanwhile, is actively diversifying its energy mix : currently dominated by hydropower, but with growing wind and solar programs and ambitious targets for clean energy. These cases serve as practical tests for our existing tools, particularly PowerPlantMatching and PyPSA-Earth, and will help us understand how they perform when applied to complete country-scale datasets. The results will feed directly into improving our methods for mapping and validating grids elsewhere.
We choose these three priorities because they address three critical gaps we’ve seen repeatedly : missing data on cross-border connections, the need for practical skills in local mapping communities, and the challenge of testing and refining tools on complete grids.
The scope of work is far larger than our core team. Interconnectors cross borders, validation requires different technical backgrounds, and building confident mapping communities depends on people with local knowledge. Whether you can map from imagery, validate data in the field, write code, or run a workshop, your contribution will improve both the map and the methods behind it. If you have skills, data, or time to share, we invite you to join the effort. The global transmission grid will keep changing. The more people we have mapping and maintaining it, the more useful it will be to everyone.